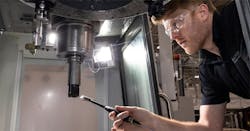
While at the International Manufacturing Technology Show (IMTS) in September 2018, I had the great fortune to meet an individual who introduced me to tap testing, which many in the industry now recognize as MSC’s trade name for the valuable service known as MSC MillMax®.
Over hours and hours of conversations, countless emails, trainings and collaborations with this individual, who is now a dear friend, I began to grasp both how and why this technology worked so well. Many times, it seemed as if it was “smoke and mirrors.” I now know better that the science is real – and I want to spread the knowledge I was so lucky to gain from this friend, and several other colleagues.
This science has a name: Machining Dynamics. Many of you have known about Machining Dynamics for years. However, I’ve been in the metalworking industry for the better part of 25 years and had never heard about it, read about it, studied it, or written about it…until now. I wish I had known much earlier.
So, what is Machining Dynamics? And why is it so important to the industry and the health of machining businesses? Machining Dynamics, simply put, is the study of vibration in machining. Basically, there is no completely stiff assembly in machining, particularly in milling operations.
For many like me, vibration in machining was believed to be due to imbalance, runout, or to lackluster fixturing or workholding. In milling, as an example, there are multiple pieces to an entire assembly. It includes the machine/machine spindle, the holder (and any extensions, if applicable), and the cutting tool (indexable or solid).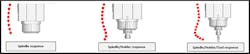
The diagram above shows why milling is more of a science than I ever suspected. As you can see, the dynamics for each part of an assembly are different. The spindle responds to a stimulus one way, the toolholder a different way, and the tool yet another way. The combination of all these items create what is essentially a unique fingerprint.
Given all these variables, how do we determine the operating speeds? The answer for most, including me up until recently, was trial and error at the machine. We’ve all done this. We review the surface footage and feed per tooth range for the tool and the material we’re machining. In many cases, we select the mid-range of the speed/feed values and program the machine to operate at that feed rate.
Sometimes the result is chatter and sometimes the result is stable. If there is chatter, the most common response is to slow down speeds to find a stable zone. If the first attempt is stable, we historically turn up the speed until we experience chatter and go back to the closest stable speed. We document the parameters and set the program there.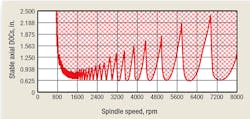
What I never realized is these unique tool assemblies typically have multiple stable zones which are surrounded by unstable zones. The chart below, known as a stability lobe diagram, highlights this common reality. The red area is unstable and the white area is stable. As you can see for this assembly, there are stable speeds just over 4,800, 5,600, 6,800 and 8,000 rpm, all surrounded by unstable zones.
This phenomenon exists in our daily lives where stable and unstable “speeds” are also apparent. You’ve probably witnessed microphone squeal from a public address system. In this case, the sound from the speaker enters the microphone after a short time period. Depending on the volume (the gain) and distance of the microphone from the speaker (which sets the time), the system can become unstable and we hear the squeal. This is equivalent to milling where the current tooth “sees” the vibration from the previous tooth. The gain in this case is the axial depth of cut and the time between teeth is set by the spindle speed.
This type of information is only gained through a brief tap test. Fifteen minutes or less. The benefits are improved Metal Removal Rates (MRR), improved surface finish and/or greater tool life. Upon administering hundreds of milling tests in just about every material, the average MRR improvement is over 300%. Yes, four times more productive. Cycle times for milling operations are 50% lower, on average, after the measurement, and capacity gained is typically over 100 annual hours. These application outcomes create a more productive and profitable machining business.
By some estimates, milling represents about 40% of the cutting tools used. If improvements like this are within reason, then I feel obligated to share this information with all of you. If this level of productivity and efficiency are possible, let’s unleash this knowledge and start driving the level of productivity that can take the United States closer to global competitiveness, greater resilience and supply chain independence.
Jamie Goettler is the Senior Director of Metalworking Sales and Innovation with MSC Industrial Supply Co. To learn more about MSC MillMax® and results like these, please visit www.mscdirect.com/solutions/millmax.
About the Author
Jamie Goettler
Senior Director, Metalworking Sales and Innovation
Jamie Goettler is Senior Director, Metalworking Sales and Innovation at MSC Industrial Supply, a distributor of metalworking and maintenance, repair and operations products and services to industrial customers throughout North America. With more than 25 years of experience in industrial distribution, Jamie is focused on the competitiveness, productivity and health of American manufacturing businesses through the creation, development and deployment of industry-relevant technology.
Over a 20-plus-year tenure with MSC, Goettler has held a series of leadership roles in sales and metalworking. He holds a U.S. patent for MSC’s cost-savings documentation mechanism and process, and he has been a driving force behind MSC’s strategic relationship with Oak Ridge National Laboratory in advancing manufacturing in the United States.
Goettler is a graduate of the University of Pittsburgh, where he earned a bachelor’s degree in rhetoric and communication.