Image

Pinpointing The Cutting "Sweet Spot"

Feb. 20, 2007
Trying to find that elusive optimal combination of spindle speed (rpm) and axial depth-of-cut by trial and error for a given tool and material is a little like looking for a needle in a haystack. But a dynamic analysis technique is available that is ...

Trying to find that elusive optimal combination of spindle speed (rpm) and axial depth-of-cut by trial and error for a given tool and material is a little like looking for a needle in a haystack. But a dynamic analysis technique is available that is designed to pinpoint the optimal cutting parameters of spindle speed and depth-of-cut for a specific tool/toolholder/machine stackup to maximize metal-removal rate while avoiding chatter. The technique is mainly used for milling, boring and turning operations with aluminum, cast iron, steel and high-temperature alloys. It's available from Manufacturing Laboratories Inc. (www.mfglabs.com) and its Midwest technical support provider D3 Vibrations Inc. (www.d3vibrations.com)

"Machine tool users do not know the performance characteristics of their machines and frequently under utilize them," said Dr. David Dilley, owner of D3 Vibrations. "Using the techniques [his company developed] we typically improve overall shop metal-removal rates by 30 percent over those obtainable with conventional techniques. The instrumentation optimizes cutting parameters in minutes when it would take customers weeks to years, if ever. The software dispels many myths of milling."
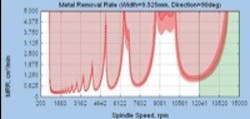
Using the MetalMax programs, a small machine shop cutting 7075 aluminum with a carbide cutter increased productivity by 400 percent. The software indicated that revising speed from an initial 12,000 rpm (point 1 in the chart) to 9,500 rpm (point 2) moved the cutting from an unstable chatter zone (crosshatched area) into a stable zone. Then, increasing depth-ofcut from 0.03 mm to 0.15 mm maximized metal-removal rate while still cutting in a chatter-free area.

The software uses stability-chart principles by listening to the cut with a microphone, then it selects a spindle speed so that tooth frequency or some multiple of tooth frequency becomes equal to chatter frequency. The technique produces a stability chart (top) that indicates chatter zones (cross-hatched) and stable, chatterfree zones. The bottom chart displays chatter frequencies (bold nonlinear lines) and line of multiples of tooth frequency (straight lines marked 2ft, 3ft . . .) as functions of spindle speed. An initial cut is at point a at a 0.5 mm depth and is in the chatter zone. The technique is to select spindle speeds so that tooth frequency or some multiple (2ft in this case) is equal to chatter frequency (moving from a to b. Depth-of cut is increased to c,but this is also in the chatter zone. An additional speed adjustment is made ( to d) and depth-of-cut increased (to e) in the chatter-free zone to maximize metal-removal rate.